
7,000 Steps, Causality, and the interpretation danger
What this Lancet Public Health meta-analysis really tells us – and what it absolutely does not

This month, a new systematic review and dose–response meta-analysis in The Lancet Public Health tried to answer a seemingly simple question:
How many steps per day are actually associated with better health outcomes?
The headline number – “about 7,000 steps per day” – exploded on social media. Underneath my own post, the comments section turned into an impromptu journal club: epidemiologists, clinicians, HEOR people, statisticians, methodologists.
The themes were very consistent:
“Are people healthy because they walk, or walking because they’re healthy?”
“Where is the control for endogeneity?”
“How do we get from an observational HR of 0.53 to the prescription ‘7,000 steps delivers large, clinically meaningful benefits’?”
“What about intensity? What about people who can’t walk 7,000 steps?”
This newsletter is my attempt to decode the evidence for you.
Instead, we are going to walk through:
What the study actually did (and did not do).
What the numbers mean, technically.
Why reverse causation and residual confounding are real, not pedantic.
How to reconcile “strong observational signal” with the cautionary tale.
How I would actually use this evidence in practice and in public communication.
1. The study in one paragraph:
The authors did a systematic review and dose–response meta-analysis of prospective cohorts where:
Exposure = device-measured daily steps (accelerometers, pedometers, wearables) in free-living adults (≥18 years).
Outcomes included:
all-cause mortality
cardiovascular disease (incidence and mortality)
cancer (incidence and mortality)
type 2 diabetes
dementia and other cognitive outcomes
depressive symptoms
physical function
falls
Key features:
Literature search from 2014–Feb 2025 .
57 studies from 35 cohorts in the systematic review;
31 studies from 24 cohorts in the meta-analyses.Step counts treated as a continuous exposure.
They tested several shapes (linear, splines, quadratic, cubic) and chose the best fit via Bayesian Information Criterion (BIC).Reference set at 2,000 steps/day (a low but realistic value for older adults).
Hazard ratios (HRs) pooled using one-stage random-effects dose–response meta-analysis.
Risk of bias: Newcastle–Ottawa Scale (most studies scored high).
Certainty: GRADE, starting from “low” (observational cohort) and upgrading where dose–response and consistency were strong.
This is at the upper end of what you can reasonably do with heterogeneous cohort data. It does not turn an observational association into a trial.
2. What did they actually find?
I’ll simplify the numbers: 7,000 vs 2,000 steps/day.
Across the pooled analyses:
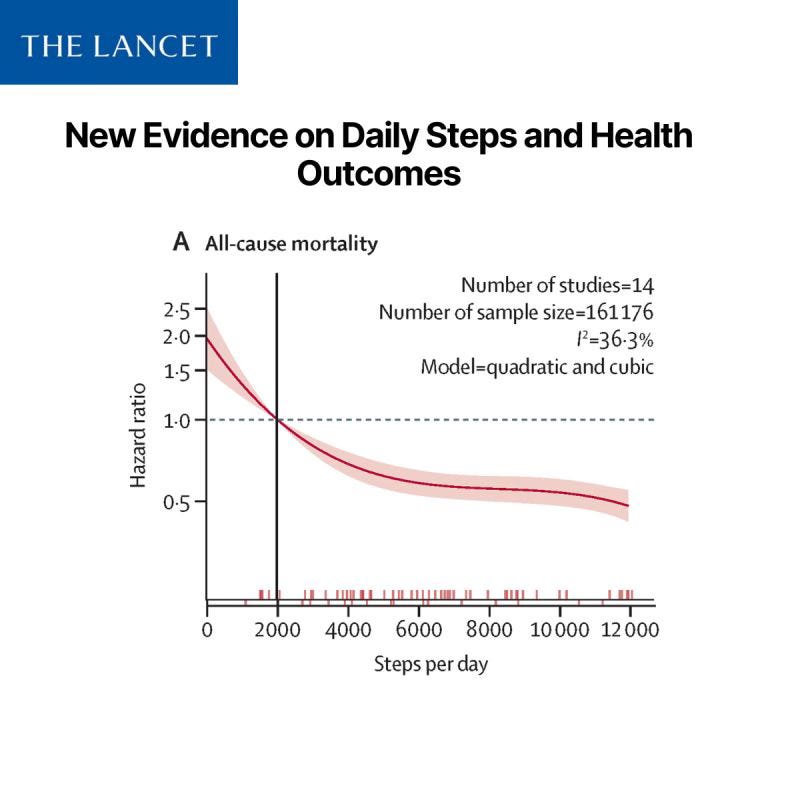
All-cause mortality
HR ≈ 0.53 (47% lower risk) at 7,000 vs 2,000 steps.
Clear inverse, non-linear association: big gains between 2,000 and ~6,000–7,000, then the curve flattens but keeps going down up to ~12,000.
Cardiovascular disease incidence
HR ≈ 0.75 (25% lower risk) at 7,000 vs 2,000.
Non-linear, with inflection around 7,800 steps overall.
Older adults showed a lower “elbow” (~5,400 steps).
Cardiovascular disease mortality
HR ≈ 0.53 at 7,000 vs 2,000, but:
only three cohorts; substantial heterogeneity; result sensitive to one large study.
Certainty: low.
Cancer
Incidence: small, imprecise association (HR 0.94; CI crosses 1).
Mortality: stronger association (HR 0.63), but again few cohorts.
Type 2 diabetes
HR ≈ 0.86 at 7,000 vs 2,000; roughly linear trend -> more steps, lower diabetes incidence.
Dementia
HR ≈ 0.62 at 7,000 vs 2,000, with a non-linear curve and inflection closer to ~8,800 steps.
Only two cohorts, but consistent direction and dose–response.
Depressive symptoms
HR ≈ 0.78 at 7,000 vs 2,000; linear association.
Falls & physical function
Falls: inverse non-linear association in pooled model, but very low certainty; deleting one large cohort made the association fragile and possibly U-shaped.
Physical function: heterogeneous studies, no pooled HR; broadly consistent with “more steps, less functional decline,” but evidence is patchy.
On GRADE, they rated certainty as moderate for:
all-cause mortality
CVD incidence
cancer mortality
type 2 diabetes
dementia
depressive symptoms
and low or very low for cancer incidence, CVD mortality, physical function, and falls.
So far so good. But now we hit the hard questions.
3. The elephant in the room: reverse causation and residual confounding
From comments on my Linkedin post:
“Sick people can’t take as many steps.”
That is not a side note; it is central.
3.1 What the cohorts did try to do
Most primary studies:
excluded people with major disease at baseline or did sensitivity analyses excluding early events;
adjusted for:
age and sex
BMI
smoking
self-reported health
sometimes education, income, etc.
The meta-analysis only included prospective cohorts (exposure measured before outcomes), which is the minimum requirement to talk about temporal sequence.
3.2 What they cannot solve
But there are at least three layers of problems they cannot fully adjust away:
Subclinical or under-documented disease
A patient can look “healthy” in a registry and still have:early heart failure,
COPD,
cancer,
neurodegenerative disease.
These conditions reduce step counts long before they are coded.
Frailty and functional reserve
Two 75-year-olds with identical ICD codes can have dramatically different:muscle mass,
balance,
sarcopenia,
falls risk.
Those factors drive both the ability to walk and the risk of death, but are rarely measured well.
Lifestyle clustering
The 7,000-step walker is not just walking more. On average, they are also more likely to:eat differently,
sleep differently,
engage in other forms of physical activity,
have different jobs and stress profiles,
be more health-conscious overall.
Even with careful adjustment, these domains are incompletely captured. So the HR of 0.53 at 7,000 vs 2,000 is not the isolated “effect of 5,000 extra steps” in an otherwise unchanged life.
It is a composite contrast between two real-world phenotypes:
“people who habitually live around ~2,000 steps/day”
vs
“people who habitually live around ~7,000 steps/day.”
Those phenotypes differ on much more than step counts.
3.3 Why this matters
Another comment invoked the hormone replacement therapy (HRT) story, and that is a good analogy to keep in mind.
Observational data once suggested HRT reduced cardiovascular risk.
Women who used HRT were healthier, wealthier, more educated – the “healthy user effect.”
RCTs later showed no such benefit, and in some cases, harm.
Physical activity is not HRT – we have mechanistic and experimental evidence that exercise improves multiple risk factors. But the logic holds:
If we treat a large observational as the causal effect size of a behavior, we are vulnerable to being misled.
So, for this paper, we should avoid language like:
“Adding 5,000 steps reduces mortality by 47%.”
and prefer something like:
“People who accumulate ~7,000 steps/day have substantially lower risk than those around 2,000, even after adjustment – consistent with a strong protective role for higher movement, plus healthier underlying status.”
That may sound less impactdull, but it is more accurate.
4. Why I still take this paper seriously
Given all that, why not just shrug and say “correlation ≠ causation, case closed”?
Because in this specific domain, we have three additional pillars:
Decades of causal-leaning evidence on physical activity and cardiorespiratory fitness (CRF)
Exercise trials demonstrate improvements in blood pressure, insulin sensitivity, lipids, functional capacity.
Higher CRF is one of the most powerful predictors of mortality we have.
Biological plausibility
We are not inventing a novel exposure with unknown mechanisms.
The pathways from movement → cardiovascular and metabolic health are well characterized.
Consistency and dose–response across outcomes and cohorts
The same basic pattern appears for mortality, CVD, diabetes, dementia, depressive symptoms.
Multiple cohorts, different countries, device types, age groups.
So I interpret the paper like this:
The exact magnitude of risk reduction is uncertain and likely inflated at the very low end by reverse causation.
The direction (more steps = lower risk, within reasonable limits) is extremely robust and biologically plausible.
The shape – steep gains from very low levels up to roughly 6–8,000 steps and then diminishing returns – is very similar to classic Pysical Activity dose–response curves (e.g. for moderate-to-vigorous minutes).
In other words:
This paper does not create a causal story from scratch; it quantifies, in step counts, a story we already believed based on stronger evidence about movement and CRF.
5. What about the magic number: is 7,000 steps “real”?
Let’s deconstruct “7,000” carefully.
5.1 Where does 7,000 come from?
It is not a biological breakpoint. It is a pragmatic anchor where:
For most outcomes, HRs at 7,000 vs 2,000 are already substantially lower.
Above 7,000, the dose–response curve continues downward, but further gains are smaller.
The full range up to ~12,000 shows no obvious harm signal in general adults.
The inflection points they estimate are:
All-cause mortality: ~5,400 steps.
CVD incidence: ~7,800 steps overall, lower in older adults.
Dementia and falls: ~8,800 steps (with high uncertainty for falls).
When they tabulate 1,000-step increments, 7,000 emerges as a point where:
the curves have clearly “bent” away from the steepest risk,
the absolute risk reduction vs very low steps is large,
the incremental benefit of pushing everyone to 10–12k becomes smaller (not zero, but smaller).
So 7,000 is best read as:
A policy-friendly level where feasibility meets substantial benefit for many adults, especially those currently around 2–4,000.
Not as:
“The true optimal number of steps for all humans.”
5.2 What about 10–12k steps? “No upper limit”?
Several people correctly pointed out that:
For all-cause mortality, going from 7,000 to 12,000 in the model yields an additional ~20% relative risk reduction vs 7,000 (depending on how you compute it).
The pooled curves do not show increased risk at high step volumes in typical general-population cohorts.
So a more nuanced message is:
If you are highly sedentary, getting to 4–5,000 is already a big win.
For many adults, 7,000 is a realistic intermediate target with clear associated benefits.
For those who enjoy higher levels and tolerate them well, 10–12,000 very likely adds further protection; the slope is simply less steep.
There is no conflict between:
“7,000 is a realistic benchmark with strong evidence,” and
“there is no clear upper limit; more is better up to at least ~10–12k for most people.”
Both are true, depending on who you are talking to.
6. Volume vs intensity: are all steps equal?
One repeated concern in the comments:
“1,000 steps wandering in a small shop is not the same as 1,000 steps in a brisk 60-minute walk.”
The paper actually tackles this in a secondary analysis on cadence (step rate):
They looked at metrics like peak 30-min step cadence.
Findings:
Higher peak 30-min cadence is associated with lower all-cause mortality.
But when they adjust for total step volume, many cadence associations become non-significant.
Translation:
In these datasets, how much you move (total steps) is the dominant signal.
Intensity adds something, but is strongly correlated with total volume and harder to disentangle.
For practice, my synthesis is:
For population messaging, you can safely emphasize total daily step volume: it is simple, objective, and strongly predictive.
For clinical prescriptions and CRF improvement, you still want bouts of higher-intensity / brisk walking – steps plus “getting out of breath” is what moves VO₂max.
Steps are a good monitor of movement behaviour, not a replacement for thinking about intensity.
7. What about people who cannot walk 7,000 steps?
Several clinicians raised an important point:
“What about patients with severe knee complications, heart failure, neurological disease? Or people whose main exercise is cycling, rowing, or swimming?”
This is not a limitation of the data only; it is also a communication risk.
A few points to keep straight:
The cohorts included various special populations (diabetes, lung disease, liver disease, HF), but they are a minority.
Step counts are a poor metric for:
cycling, rowing, swimming,
many wheelchair users,
people who primarily do upper-body training.
So:
For the general ambulatory adult population, daily steps are a practical and useful metric.
For people who cannot accumulate many steps:
you should translate the same dose of movement into other modalities (e.g. minutes of cycling, water exercise, resistance training),
and not enforce step targets that are unrealistic or unsafe.
Guidelines still rest on total moderate-to-vigorous physical activity, of which walking is just one mode.
8. How I would actually communicate this to different audiences
8.1 For clinicians and health professionals
A formulation I’m comfortable with:
“This meta-analysis pooled data from more than 20 prospective cohorts and found a strong, consistent association: people who accumulate more daily steps have substantially lower risks of premature death, cardiovascular disease, diabetes, dementia and depression.
The biggest gains happen when you move from very low levels (around 2,000 steps/day) up to about 6–8,000. Beyond that, risk continues to fall, but more gradually.
It is observational, so some of that effect is because healthier people can walk more. But taken together with trial and mechanistic evidence on physical activity and fitness, it strongly supports a simple, pragmatic message:
If you can, move more than you do today. For many adults, working gradually toward ~7,000 steps/day, and beyond if tolerated, is both realistic and clinically meaningful.”
…followed by nuance for the individual patient:
joint disease, frailty, comorbidities, preferences, non-walking exercise, etc.
8.2 For policy and public health
I would not frame this as “replace 150 minutes/week with 7,000 steps/day and we’re done.”
Instead:
Integrate steps as a parallel metric in guidelines:
e.g. “150–300 minutes/week of moderate intensity OR roughly 7–10k steps/day on most days, for those who can walk.”
Use 7,000 as a realistic target in population messaging, especially for highly sedentary groups, while still celebrating higher volumes.
Make explicit that any increase from a very low baseline is beneficial.
8.3 For researchers and methodologists
The paper itself raises some interesting opportunities:
Harmonised re-analyses with causal inference frameworks (e.g. marginal structural models, G-formula) across cohorts, focusing on:
time-varying confounding (illness → activity → outcomes),
competing risks in older adults.
More precise evaluation of:
device type and wear location,
step-derived thresholds by age, frailty, and baseline health.
Trials that use step counts as both target and adherence measure for Pysical Activity interventions, connecting change in steps → change in intermediate outcomes → hard endpoints.
For now, however, the meta-analysis is the best “big picture” we have on steps specifically.
9. My bottom line for “Evidence Decoded”
If I had to compress this paper into three sentences for you:
This Lancet Public Health meta-analysis offers a strong, observational dose–response signal: more daily steps are associated with lower risks of mortality, CVD, diabetes, dementia and depressive symptoms, with large gains as you move from ~2,000 to ~7,000 steps/day.
The numbers are not causal effect sizes; they are shaped by reverse causation, residual confounding, and selection bias. We should not claim that “prescribing 5,000 extra steps halves mortality” for any given individual.
When interpreted in the context of decades of evidence on physical activity and cardiorespiratory fitness, the study supports a pragmatic, honest message:
“If you can walk, every extra 1,000 steps from a low baseline is likely to help. For many adults, gradually working toward around 7,000 steps/day – and beyond if you enjoy it – is a realistic and clinically meaningful goal, alongside other forms of movement, diet, sleep and risk-factor control.”
Reference: Ding, Ding, et al. “Daily steps and health outcomes in adults: a systematic review and dose-response meta-analysis.” The Lancet Public Health 10.8 (2025): e668-e681.